USD
USD
FANUC Common Troubleshooting Without Alarm Messages
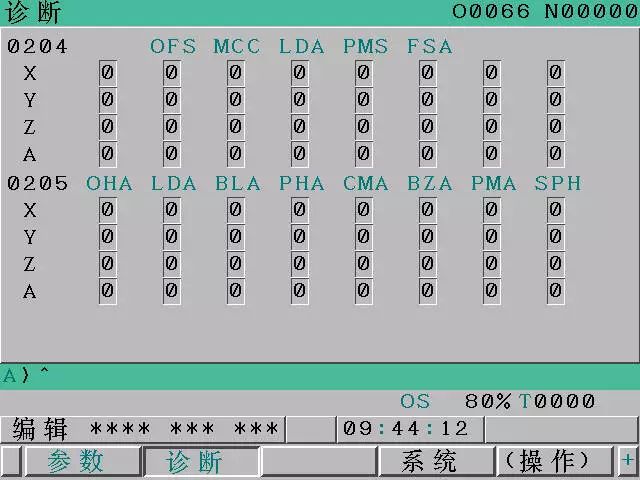
When a Fanuc CNC system encounters a fault without displaying any alarm messages, troubleshooting can be performed through the system’s diagnostic screen. The diagnostic screen provides alarm signals and monitoring data when abnormalities occur, which serve as the basis for fault analysis.
Using the Diagnostic Function to Troubleshoot Faults
How can we effectively use diagnostic information provided by the diagnostic function to help locate and eliminate faults? This is undoubtedly the most important issue. Let’s go through how to use the diagnostic function to resolve certain hidden faults that often occur in practice.
(1) Diagnostic No. 000 = 1
This indicates that the system is executing an auxiliary function (M code). While the auxiliary function is being executed, No. 000 will remain “1” until the auxiliary function signal is completed. Therefore, if the execution time of the auxiliary function exceeds the normal value, it may be due to the required conditions not being met. In such cases, when abnormalities occur without alarms and No. 000 is “1,” check whether the machine action corresponding to the auxiliary function has been completed.
• Fault Example: On a CNC machine in automatic mode, whenever M8 (coolant on) is executed, the machining program stops progressing. Coolant is visibly flowing, but no alarm is displayed.
• Troubleshooting Approach: Calling up the diagnostic screen shows No. 000 = 1, indicating the auxiliary function (coolant on) has not been confirmed as complete. Checking the electrical diagram reveals a flow switch installed on the coolant line to confirm coolant output. Monitoring the PMC signal screen shows input point X2.2 remains at 0 (should be 1 when coolant flows). Thus, the flow switch is not operating properly despite actual coolant flow. After adjusting the sensitivity of the switch and lubricating its mechanism, the switch functions normally. A test run confirms the issue is resolved.
(2) Diagnostic No. 003 = 1
This indicates the system is checking whether a moved servo axis has accurately reached the commanded position. If the axis fails to position correctly, No. 003 will remain “1.”
• Fault Example: During automatic machining, the machine frequently stops unexpectedly, especially after Z-axis movement. The program halts but may resume after several seconds—or may not resume at all. No alarms are displayed.
• Troubleshooting Approach: The diagnostic screen shows No. 003 = 1 (in-position check). Checking Diagnostic No. 300 reveals a Z-axis position deviation of 50, while the allowable tolerance (set by parameter 1826) is 4. Since the deviation exceeds tolerance, the system considers positioning incomplete and retries endlessly, halting program execution. Position deviation = (Feedrate ÷ 60) × Servo loop gain. By reducing the servo loop gain (parameter 1825), the Z-axis deviation is reduced to 1—below the tolerance value. Problem resolved.
(3) Diagnostic No. 005 = 1
This indicates that servo axis interlock or start lock signals are active, preventing axis movement due to unsafe conditions. Interlock signals in PMC include:
• G8.0: Prohibit all servo axes
• G130.0–G130.3: Prohibit movement of axis 1–4
• G132.0–G132.3: Prohibit positive-direction movement of axis 1–4
• G134.0–G134.3: Prohibit negative-direction movement of axis 1–4
• Fault Example: A CNC special-purpose machine stops when executing G90 G01 Z0;. After reset and restart, the program always halts at the same block with no alarm.
• Troubleshooting Approach: Diagnostic No. 005 = 1, meaning servo axis interlock active. Checking PMC shows G130.0 = 0. Since Z-axis is axis 1, tracing the ladder logic reveals both turret up/down proximity switches are ON simultaneously. The turret is actually down, but the up-sensor is stuck due to metal chips, producing a false signal. After cleaning the switch, G130.0 = 1, Z-axis interlock is cleared, and the fault is resolved.
(4) Alarm 350
Abnormality in the internal control section of the α-series serial pulse encoder. Use Diagnostic No. 202 and 204 to identify the specific cause.
(5) Alarm 351
Communication error between α-series serial pulse encoder and module. Use Diagnostic No. 203.
(6) Alarm 400
Servo module or motor overheating. Use Diagnostic No. 200 and 201.
(7) Alarm 414
Servo module or motor abnormality. Use Diagnostic No. 200, 201, 204 and LED alarm on servo module.
(8) Alarm 416
Position detector signal open/short. Use Diagnostic No. 200 and 201.
(9) Alarm 417
Servo parameter setting abnormal. Use Diagnostic No. 203 and 280.
(10) Alarm 749
Spindle servo module abnormality. Use Diagnostic No. 408.
(11) Alarm 750
Spindle servo module in serial spindle system fails to start properly on power-up. Use Diagnostic No. 409.
⸻
3. Handwheel (Manual Pulse Generator) Not Working
If the handwheel does not function, possible causes include:
• Servo not enabled (not ready).
• MPG not connected properly to I/O interface or module.
• I/O Link not assigned or incorrectly assigned.
• Incorrect parameter settings preventing signal input.
Countermeasures:
1. Check if servo amplifier LED shows “0” (indicating ready). Other numbers = not ready.
2. Check cables for open/short circuits.
3. Check the handwheel (pulse signals valid?).
4. Check I/O Link assignments.
5. Check parameters and input signals.
Also verify CNC mode on the CRT lower-left corner: must be HND (Handle mode). If not, mode selection is incorrect.
• Use PMC diagnostics (PMCDGN) to confirm mode selection: Handwheel = G0043 “MD4=1, MD2=0, MD0=0.”
• Check handwheel feed axis selection signals.
• Check handwheel feedrate selection: PMC PMCDGN confirms signals G0019 (MP2, MP1 bits).
On indexing tables, the handwheel feed for the indexing axis may not function if signals are not properly set.